Prometheus I²C Probe
In this project, we want to collect environmental data and put it into Prometheus. We are using a number of different sensors and using data from the device itself to export to a Prometheus Push Gateway.
The following hardware was used in this project:
- Raspberry Pi Zero V1.3 to run on
- Generic Micro-USB 5 GHz wifi adapter
- Generic AHT10 temperature and humidity sensor
- CCS811 air quality sensor for CO₂ and TVOC measurements
- 3D printed case
This project could theoretically have been done with an Arduino instead of a Raspberry Pi Zero, but using a full ARM computer made it more versatile and allowed for more easy expansion of the functionality in the future. The trade-offs are probably worse power consumption and more heat (see below for where that becomes relevant).
Code
The source code can be found in my local Subversion repository. To check it out:
$ svn co https://svn.caoimhe.io/svn/i2c-probe-prometheus/trunk/ i2c-probe-prometheus
3D printed case
Under rpi-sensor-probe-case.scad, there is a 3D model of a case that was designed with a few criteria in mind:
- Leave plenty of space for the Raspberry Pi Zero
- Have a gap for an USB wifi controller to be attached
- Lots of grid style openings for better case air flow
- Buffer chambers separating the Raspberry Pi and Wifi controller, which produce significant heat, from the temperature sensor and CO₂ module, which are heat sensitive
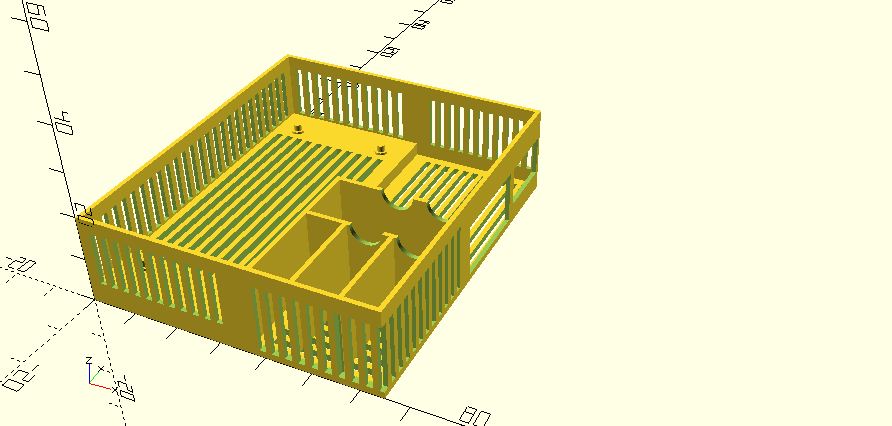
rpi-sensor-probe-lid.scad contains the corresponding lid to put on top of the case. This model is much less exciting since it basically just contains a lid with a couple of grid holes for air flow.
Assembling
We need to wire two I²C devices up to the same Raspberry Pi in this project. Following the instructions from Instructables, we can wire the AHT10 up to the regular I²C pins of the Raspberry Pi, but we will need to create a virtual second I²C bus using the GPIO pins. In this case we are going with the following layout (see the Raspberry Pi Zero pin-out):
- Pin 1 (3V): VIN of the AHT10 controller
- Pin 3 (GPIO 2): SDA (I²C data signal) of the AHT10 contoller
- Pin 5 (GPIO 3): SCL (I²C clock signal) of the AHT10 contoller
- Pin 6 (Ground): GND of the AHT10 controller
- Pin 9 (Ground): GND of the CCS811 controller
- Pin 11 (GPIO 17): SDA (I²C data signal) of the CCS811 controller
- Pin 13 (GPIO 27): SCL (I²C clock signal) of the CCS811 controller
- Pin 14 (Ground): WAK (Wake signal) of the CCS811 controller
- Pin 17 (3V): VIN of the CCS811 controller
Pins 2 and 20 can also be wired up to a case fan in case you get too much heat interference on the temperature sensor.
Note that we are hard-wiring the wake signal of the CCS811 sensor to ground here, which will make the sensor always-on. There are more energy efficient ways to run this sensor, which may be explored further in a future revision of this project.
Also note that you need to use sufficiently long wires to make sure you can wiggle them through the holes in the side of the only separators that don't have openings for cooling. These holes are intentionally in the side walls to avoid accidental heat transfer from the Raspberry Pi and wifi controllers.
With this, your Raspberry Pi should be ready for its first boot.
Boot loader configuration
Since we just used a few more GPIO pins to make an additional I²C bus, we will have to tell our Raspberry Pi about it.
First, we need to enable I²C in the first place. In order to do
this, we need to run
raspi-config,
go to Interface Options, I2C and say Yes to
enabling I²C.
Then, we need to build a new I²C bus from the pins we wired the
CCS811 controller up to. To do this, we edit the file
/boot/config.txt, find the section which reads
dtparam=i2c_arm=on, and add a new line below that
saying:
dtoverlay=i2c-gpio,bus=3,i2c_gpio_delay_us=1,i2c_gpio_sda=17,i2c_gpio_scl=27
This creates a new i2c-gpio overlay bundling two GPIO
pins into an I²C bus 3, with 1 µs delay accepted. The data pin
is GPIO 17 (pin 11 on the RPi0), and the clock pin is
GPIO 27 (pin 13 on the RPi0). We are using bus 3 here because
1 is already in use by the AHT10, and 0 and 2 are reserved for
internal use of the Raspberry Pi as per the Instructables
documentation.
Writing the software
While I have already written the software for this project and made it ready to be used by anyone, this section attempts to outline the design criteria that went into it, and the way the software is structured in general.
AHT10 temperature sensor
Since the CCS811 controller requires environmental data to correct for in order to get proper readings, it makes sense to set it up first.
First, we should check whether we can see the AHT10 on I²C bus 1:
            $  i2cdetect -y 1
                 0  1  2  3  4  5  6  7  8  9  a  b  c  d  e  f
            00:          -- -- -- -- -- -- -- -- -- -- -- -- --
            10: -- -- -- -- -- -- -- -- -- -- -- -- -- -- -- --
            20: -- -- -- -- -- -- -- -- -- -- -- -- -- -- -- --
            30: -- -- -- -- -- -- -- -- 38 -- -- -- -- -- -- --
            40: -- -- -- -- -- -- -- -- -- -- -- -- -- -- -- --
            50: -- -- -- -- -- -- -- -- -- -- -- -- -- -- -- --
            60: -- -- -- -- -- -- -- -- -- -- -- -- -- -- -- --
            70: -- -- -- -- -- -- -- --
            $
The 38 indicates that we can reach the controller on the bus at address 0x38.
The example code for the AHT10 uses the Adafruit libraries, which are not part of Raspbian and seem somewhat overkill to control a simple I²C device. There is an example using only the smbus library on Github.
To initialize the controller, we need to write two bytes to its config register 0xE1, saying that we want to reset/start calibration (0x08), and zero otherwise.
            config = [0x08, 0x00]
            self.bus.write_i2c_block_data(self.smbus_addr, 0xE1, config)
We should get a status byte as a result. The byte can be interpreted according to the datasheet, but most importantly we are looking for whether Bit[3] is set (the device is calibrated). It may make sense to wait for a small amount of time between writing the reset config and looking for a calibrated status.
To read a measurement, we have to write the bit sequence 0011 0011 (0x33) to the command register 0xE1 and wait for the busy (Bit[7]) bit to disappear in the status register. Then we can read the result register 0x00. We should get 6 bytes, with bytes 1 and 2 being part of the humidity, 4 and 5 being part of the temperature, and byte 3 being split between the two. See the datasheet for more details, also on how to convert these measurements into human readable data (or just follow along in the Python code).
We use a namedtuple to return the data in a structured way:
AHT10Data = namedtuple('AHT10Data', ['temperature', 'humidity'])
CCS811 air quality sensor
Now that we have temperature and humidity data, we can feed that to the CCS811 so we get more accurate measurements on the CO₂ and total value of organic compounds (TVOC) levels in the room.
Adafruit has a guide for using the CCS811 using their libraries which has a lot of information and links about the sensor. To complement this knowledge, we can take a look at the Arduino specific manuals. There is also a very useful datasheet with lots of details about the workings of the controller.
Once again, we check for the presence of the CCS811 controller on the I²C bus 3:
            $ i2cdetect -y 3
                 0  1  2  3  4  5  6  7  8  9  a  b  c  d  e  f
            00:          -- -- -- -- -- -- -- -- -- -- -- -- --
            10: -- -- -- -- -- -- -- -- -- -- -- -- -- -- -- --
            20: -- -- -- -- -- -- -- -- -- -- -- -- -- -- -- --
            30: -- -- -- -- -- -- -- -- -- -- -- -- -- -- -- --
            40: -- -- -- -- -- -- -- -- -- -- -- -- -- -- -- --
            50: -- -- -- -- -- -- -- -- -- -- 5a -- -- -- -- --
            60: -- -- -- -- -- -- -- -- -- -- -- -- -- -- -- --
            70: -- -- -- -- -- -- -- --
            $
In this example, we see our controller at address 0x5A, which we can use in our code to communicate with it. Note that we have to connect to SMBus(3) instead of SMBus(1) here, since we have set up a separate I²C bus.
To start the CCS811, we need to do an empty write to the 0xF4 register to reset the controller. Then we need to set the measurement interval and interrupt mode (we didn't wire up the interrupt pin, so we will want to run with interrupts disabled). We set the upper 4 bits of the mode config register (0x01) to 0x03 (a measurement once a minute), and leave Bit[3] disabled (no interrupts).
            self.bus.write_i2c_block_data(self.smbus_addr, 0xF4, [])
            self.bus.write_byte_data(self.smbus_addr, 0x01, (0x03 << 4))
Before reading any data, we should write the environmental data (temperature, humidity) to the ENV_DATA register (0x05):
            humidity = int(data.humidity * 512)
            temperature = int((data.temperature + 25) * 512)

            env_data = [
                (humidity >> 8) & 0xFF,
                humidity & 0xFF,
                (temperature >> 8) & 0xFF,
                temperature & 0xFF,
            ]

            self.bus.write_i2c_block_data(self.smbus_addr, 0x05, env_data)
We can then check the status register 0x00 for the Bit[3] being set, which indicates that there is data ready to be read. Once we have data waiting, we can fetch the latest data points from the data register (0x02):
            status = self.bus.read_byte_data(self.smbus_addr, 0x00)
            if status & (1 << 3):
                data = self.bus.read_i2c_block_data(self.smbus_addr, 0x02, 8)
                co2 = (data[0] << 8) | (data[1])
                tvoc = (data[2] << 8) | (data[3])
WPA Supplicant connection quality
One more set of data points we can squeeze out of the Raspberry Pi is the wifi quality. This data is reported by wpa_supplicant.
While wpa_supplicant does have a dbus API, unfortunately, Raspbian starts two wpa_supplicant processes; one is launched from systemd and available via the dbus API, but it is not connected to any wifi interfaces, and the other one is launched from dhcpcd and is not available via the dbus API. So we need to talk to wpa_supplicant directly using its own control socket.
Unfortunately, the way the wpa_supplicant control socket works is a bit unusual; you need to create your own socket and use the target address to talk to the wpa_supplicant socket, but you will receive the reply on the socket you created.
            with tempfile.TemporaryDirectory() as tmpdir:
                self.retsock = socket.socket(socket.AF_UNIX, socket.SOCK_DGRAM)
                self.retsock.bind(tmpdir + '/talk-to-wpa-supplicant')
                self.retsock.connect(if_path)

                self.retsock.send(b'SIGNAL_POLL')
                data = self.retsock.recv(4095)
This should yield a text representation of:
- RSSI: Received Signal Strength Indicator, see the excellent explanation from metageek on what this means. Negative number, closer to 0 means better wifi signal quality.
- LINKSPEED: negotiated link speed in Mbps. Higher is obviously better. Note that this speed might not actually be reached, depending on the signal quality.
- NOISE: noise in dBm on the signal; not all wifi cards report this correctly. If this is constant 9999, the card does not.
- FREQUENCY: the frequency the wifi is operating at, in MHz.
Prometheus integration
There are multiple ways to integrate this data with Prometheus. If your devices have static IPs and are always reachable from the Prometheus server, you can implement a regular HTTP handler and have Prometheus scrape your sensor probe directly. In this example, we assume that this is not the case, and use the Pushgateway functionality. Essentially, the pushgateway buffers data for Prometheus to scrape, and can be used for jobs that are not running constantly, or are behind some form of communication barrier.
We need to set up a registry and all the metrics we want exported:
            self.registry = CollectorRegistry()
            self.temperature = Gauge('measured_temperature',
                                     'Temperature as measured by the sensor',
                                     registry=self.registry)
Then, once we receive data, we just need to set() the metrics to the correct values, and use push_to_gateway() to push it to our Prometheus Push Gateway.
            self.temperature.set(aht10_data.temperature)
            self.humidity.set(aht10_data.humidity)

            push_to_gateway(self.gateway_addr,
                            job=self.job_name,
                            registry=self.registry)
When running this code, you should start seeing data on the status page of your pushgateway.
Installing the software
Now that we have understood how to control our hardware, we need to make sure that our software interacts well with it. This means we need to start using some software to write the data to Prometheus, and set up Prometheus itself.
Installing the pre-made software
If, instead of rolling your own, you want to use the software I wrote to read data from my sensors, you can set it up relatively easily.
Step 1: check out the source code to /usr/local:
            $ sudo apt install -y python3-prometheus-client python3-smbus python3-pytimeparse
            $ cd /usr/local
            $ sudo svn co https://svn.caoimhe.io/svn/i2c-probe-prometheus/trunk i2c-probe-prometheus
            $ sudo chown -R pi:users i2c-probe-prometheus
            $ cd i2c-probe-prometheus
            $ sudo install -o root -g root -m 0644 i2c-probe-prometheus.default /etc/default/i2c-probe-prometheus.pi
            $ sudo install -o root -g root -m 0644 i2c-probe-prometheus@.service /lib/systemd/system
            $ sudo systemctl daemon-reload
This will prepare you so you can start running an I²C probe as user pi. Unless you run your push gateway on the localhost (in which case, why are you using it in the first place?), you will have to update the PROMETHEUS_PUSHGATEWAY_ADDR setting in /etc/default/i2c-probe-prometheus.pi. The rest of the defaults should be fine given our wiring and boot config settings.
Now we just need to instruct systemd to launch our service at boot time:
            $ sudo systemctl enable --now i2c-probe-prometheus@pi.service
            $ systemctl status i2c-probe-prometheus@pi.service
The service should now show up as running successfully. You should see regular data pushes on your pushgateway.
Setting up the Prometheus server side
This part should be done on your monitoring server. You will first need to install Prometheus and the push gateway if you haven't already:
$ sudo apt install -y prometheus pushgateway
Now we just need to add a section to the prometheus configuration to start scraping data from the push gateway. For this, we edit /etc/prometheus/prometheus.yml:
            - job_name: 'pushgateway'

              # Override the global default and scrape targets from this job every 5 seconds.
              scrape_interval: 30s
              scrape_timeout: 30s

              static_configs:
                - targets: ['localhost:9091']
Now, Prometheus should scrape data from the push gateway every 30 seconds. You should now see your pushed metrics start showing up in Prometheus, such as measured_temperature. You can now write a console for your measurement data to have a more fancy way to display it.
Installing Prometheus Blackbox Exporter
If it is possible for your Prometheus server to connect to your Raspberry Pi, you can install the Prometheus Blackbox exporter, which gets some metrics about probing specific services from the outside. We can use it to get more monitoring data into Prometheus on what the connectivity between your monitoring server / router and the prober look like.
Setting up the Blackbox Exporter on the Raspberry Pi is not so tricky; you just have to install the Debian package.
$ sudo apt install -y prometheus-blackbox-exporter
On your server running Prometheus, you will have to set up scraping for the new blackbox exporter. To do that, you need to add the following configuration to /etc/prometheus/prometheus.yml:
            - job_name: 'blackbox-ssh-kitchen'
              metrics_path: '/probe'
              params:
                module: ['ssh_banner']
              static_configs:
                - targets:
                  - '192.168.1.123:22'
                  - '192.168.1.124:22'
                  - '192.168.1.125:22'
                  - '192.168.1.142:22'
              relabel_configs:
               - source_labels: [__address__]
                 target_label: __param_target
               - source_labels: [__param_target]
                 target_label: instance
               - target_label: __address__
                 replacement: 'wifi-probe-kitchen.local:9115'
            - job_name: 'blackbox-icmp-kitchen'
              metrics_path: '/probe'
              params:
                module: ['icmp']
              static_configs:
                - targets:
                  - '192.168.1.1'
                  - '192.168.1.123'
                  - '192.168.1.124'
                  - '192.168.1.125'
                  - '192.168.1.142'
              relabel_configs:
               - source_labels: [__address__]
                 target_label: __param_target
               - source_labels: [__param_target]
                 target_label: instance
               - target_label: __address__
                 replacement: 'wifi-probe-kitchen.local:9115'
This will start probing the specified list of IPs and ports for the specified services, and record timeseries about success rates and latencies into Prometheus. This data can then later also be added to a dashboard.
Installing a Smokeping Prober
Another way to test how well your wifi connection is working is to just use it and gather statistics about latency and packet loss. This is what Smokeping was designed to do. It also has a very useful master-slave mode (unfortunately named) which allows multiple client probes to ping the same targets and to collect the aggregate data in a graph so you can see quality issues in parts of your wifi.
In order to set this up, we need to install the smokeping package on our Raspberry Pi nodes:
$ sudo apt install -y smokeping
Then we have to set up the /etc/default/smokeping file to do something completely different:
            # /etc/default/smokeping: Startup configuration for smokeping(1)
            #
            # select master or slave mode
            MODE=slave
            # in master mode, the rest of the configuration is in
            # /etc/smokeping/config
            #
            # in slave mode, uncomment and set the following variables too
            # see smokeping(1)
            #
            # Mandatory configuration
            MASTER_URL=http://your-server/cgi-bin/smokeping.cgi
            SHARED_SECRET=/etc/smokeping/secret.txt
            #
            # Optional configuration
            SLAVE_NAME=wifi-probe-kitchen
For each prober node, you need to generate a password and put that into /etc/smokeping/secret.txt.
Setting up the Smokeping server side
On the server side, the smokeping package is already set up correctly, but we still need to add some more configuration to allow the probers to push data, and to tell them what to do.
First, we add our probers to the /etc/smokeping/config.d/Slaves file and configure a secrets file to use there:
            *** Slaves ***
            secrets=/etc/smokeping/smokeping_secrets

            + wifi-probe-kitchen
            display_name=kitchen
            location=Kitchen Counter
            color=00ff00
The smokeping_secrets file has the format nodename:password, for example:
wifi-probe-kitchen:1amv3rys3kr1t
The content of this line should of course match the contents of the /etc/smokeping/secret.txt file on the prober.
Now all we need to do is to tell the probers what they should be monitoring. For this we add entries to our /etc/smokeping/config.d/Targets configuration file for the service we want to monitor, and the probes we want it monitored from:
            ++ fritzbox

            menu = fritzbox
            title = fritz.box
            host = 192.168.1.1
            slaves = wifi-probe-kitchen wifi-probe-xyz
$ install -o www-data -g www-data -m 0775 -d /var/lib/smokeping/__cgi/ISP
Known Issues
There are a few known issues with the setup as described above:
Heat transfer to the temperature sensor
The gap between the Raspberry Pi and wifi controller on the one side (heat producers) and the temperature sensor on the other side (heat measurement) is insufficient so the reported temperature is still higher than ambient.
This can be observed clearly in a heat image. Even when the Raspberry Pi Zero and all components are inside of the case, there is still significant heat dissipation observable from the outside:

This heat is not only coming from the Raspberry Pi itself; the wifi adapter is also creating a lot of heat, as can be observed when removing the lid from the case:

The temperature in the compartment that contains the temperature sensor is significantly lower than that of the controllers, as can be observed in this thermal image:

However, the temperature is still above ambient. I will run more experiments in the future to determine what solutions work best for this problem. So far all I had was a rather large stepper motor cooler from an Ultimaker, which works ok on the 5V of the Raspberry Pi, but it seems to disturb the CO₂ sensor readings.
Future Work
A few more improvements could be made to this project in the future:
- The CCS811 generates baseline data for the first 20 minutes after starting up, generating inaccurate results. Subsequent startup times can be shortened significantly by saving the baseline data between runs, so we should probably start doing that.
- BME280 pressure sensor support